| Lesson 5 | Detecting full-table scans with EXPLAIN PLAN |
| Objective | Identify a full-table scan. |
Detecting Full-table Scans with EXPLAIN PLAN
You can detect full-table scans using the `EXPLAIN PLAN` in Oracle 19c. A full-table scan occurs when Oracle reads all the rows in a table instead of using an index to retrieve specific rows efficiently.
Steps to Detect Full-Table Scans Using EXPLAIN PLAN
Identifying a Full-Table Scan
In the execution plan output, if you see `TABLE ACCESS FULL`, it indicates that Oracle is performing a full-table scan rather than using an index.
Example Output:
Reasons for Full-Table Scans
How to Avoid Full-Table Scans
If a full-table scan is causing performance issues, consider:
Alternative: Using AUTOTRACE to Check Execution Plan and Statistics
Instead of `EXPLAIN PLAN`, you can use:
Conclusion
Steps to Detect Full-Table Scans Using EXPLAIN PLAN
-
Generate the Execution Plan for your SQL query:
EXPLAIN PLAN FOR SELECT * FROM customers WHERE last_name = 'Smith'; SELECT * FROM TABLE(DBMS_XPLAN.DISPLAY); - Look for the TABLE ACCESS FULL operation in the execution plan output.
Identifying a Full-Table Scan
In the execution plan output, if you see `TABLE ACCESS FULL`, it indicates that Oracle is performing a full-table scan rather than using an index.
Example Output:
--------------------------------------------------------------------------------
| Id  | Operation         | Name      | Rows  | Bytes | Cost (%CPU)| Time     |
--------------------------------------------------------------------------------
|   0 | SELECT STATEMENT  |           |       |       |   250 (100)|          |
|   1 |  TABLE ACCESS FULL| CUSTOMERS |  1000 |  5000 |   250  (50)| 00:00:03 |
--------------------------------------------------------------------------------
- Operation:
TABLE ACCESS FULL - Table Name:
CUSTOMERS - Cost: Higher cost indicates expensive operations.
Reasons for Full-Table Scans
- Missing Indexes on columns used in
WHEREconditions. - Small Table Optimization: Oracle may choose a full-table scan if the table is small.
- High Percentage of Rows Returned: If your query retrieves a large portion of the table, Oracle may prefer a full scan.
- Full Scan Hint (
FULL(table_name)): If explicitly hinted. - Inefficient Query Conditions: Using functions on indexed columns (
WHERE UPPER(column) = 'VALUE'). - Parallel Query Execution: If Oracle decides to use a parallel full-table scan.
How to Avoid Full-Table Scans
If a full-table scan is causing performance issues, consider:
-
Creating or using indexes:
-
CREATE INDEX idx_last_name ON customers(last_name);
-
-
Analyzing statistics for the optimizer:
-
EXEC DBMS_STATS.GATHER_TABLE_STATS('HR', 'CUSTOMERS');
-
-
Using index hints to force index usage:
-
SELECT /*+ INDEX(customers idx_last_name) */ * FROM customers WHERE last_name = 'Smith';
-
-
Refactoring queries to avoid function-based scans:
-
-- Avoid using functions on indexed columns SELECT * FROM customers WHERE last_name = 'SMITH'; - Instead of:
-
SELECT * FROM customers WHERE UPPER(last_name) = 'SMITH'; - (This would prevent the use of an index on
last_nameunless an index on UPPER(last_name) is created.)
-
Alternative: Using AUTOTRACE to Check Execution Plan and Statistics
Instead of `EXPLAIN PLAN`, you can use:
SET AUTOTRACE ON
SELECT * FROM customers WHERE last_name = 'Smith';
- This will show whether a full-table scan occurs along with statistics.
Conclusion
- YES, you can detect full-table scans using
EXPLAIN PLANby checking forTABLE ACCESS FULL. - If a full-table scan is not intended, you should analyze the cause and optimize using indexes, statistics, or query refactoring.
Oracle slow-downs
As mentioned in prior lessons, unnecessary full-table scans are those scans that search full tables when the information resides within a small percentage of rows, are a common cause of Oracle slow-downs. In a full-table scan, the whole table may not be required to service the query, but Oracle cannot see any indexes that can be used to avoid a full-table scan. Rather, Oracle reads up to the high water mark for the table. The high water mark indicates the last block in the table that has ever had a row placed on the block. Because of the I/O intensive nature of reading a whole table, Oracle uses multi-block I/O to read the table blocks from disk. This multi-block I/O is governed by the init.ora parameter called db_multiblock_read_count.
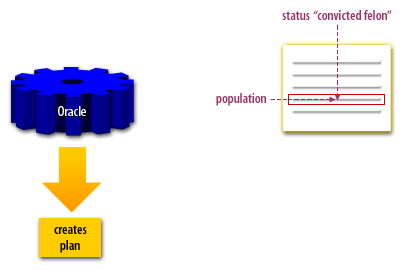
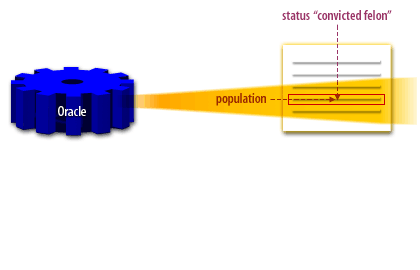
The most common cause of an unnecessary full-table scan is the lack of an index. The following series of images will help clarify how unnecessary full-table scans occur.
The most common cause of an unnecessary full-table scan is the lack of an index. The following series of images will help clarify how unnecessary full-table scans occur.
Oracle Checks Library Cache


Full-table scan
It is critical to understand that a full-table scan is a symptom of a possible sub-optimal SQL plan.
While not all full scans are bad to performance,
full table scans are a symptom of other common tuning problems like missing indexes and sub-optimal schema statistics (dbms_stats). For small tables, a full-table scan is better than a full-scan.
However, for a large-table, a full-table scan should always be examined as a potential problem.
- Full scan I/O costs less than index I/O:
When Oracle reads a table front to back during a full-table scan, we save a great deal of disk latency. Remember, 96% of the disk latency is the time required for the read-write head to move itself under the proper cylinder. Once there, the read-write head sits idle and the platter spins beneath it, and Oracle can read-in data blocks as fast as the disk platter can spin, a processed called the db file scattered read.
Appropriate full-table Scans
There are cases, however, where full-table scans are appropriate. These cases include:
The goal of detecting full-table scans is to determine if the creation of an index will replace the full-table scan with an index range scan. The most common approach to look for full-table scans is to use a tool such as Oracle’s SQL*Analyze to grab SQL from the library cache, which you practiced using a different scenario in an earlier lesson. Let us try this with the following simulation:
- Scans against small tables with fewer than 300 rows
- Queries that will access more than half of the table rows (These may run faster with a full-table scan than by accessing the rows via the index.)
- Queries that compute the minimum (MIN), maximum (MAX) or average (AVG) of a table column value, where most of the table rows are required
The goal of detecting full-table scans is to determine if the creation of an index will replace the full-table scan with an index range scan. The most common approach to look for full-table scans is to use a tool such as Oracle’s SQL*Analyze to grab SQL from the library cache, which you practiced using a different scenario in an earlier lesson. Let us try this with the following simulation:
- Detecting full-table scans using EXPLAIN PLAN
- With the Oracle Enterprise Manager open, click the Oracle SQL Analyzer button.
- Read the opening screen, and click OK.
- Now we are ready to begin. Select the bottommost database under the Databases folder.
- Select Top SQL from the mon1 database.
- The TopSQL Options box will allow you to control the number of disk reads as well as apply various filters. Click OK.
- SQL disk reads appear in ascending order. The first row, which begins select/*+first_rows*/ has already been selected for you. Click the SQL Text tab.
- The SQL text now appears in the SQL Text Tab window. Place your cursor anywhere in the SQL text field to highlight the text.
- In an actual Oracle environment, you would press Ctrl+C to copy this text and Ctrl+N to move to a new screen. For the purposes of this simulation, press Enter to move to a new SQL screen.
- For the purposes of this simulation, place your cursor in the SQL statement window and hit Enter to paste your SQL text. You would normally accomplish this by pressing Ctrl+V.
- Typically, you would press F9 to see the rule-based EXPLAIN PLAN, but for the purposes of this simulation press Enter.
- Here we see a full-table scan.
Viewing the Execution Plan
Execution plans are hierarchical in nature. That is, the task of executing a query is one large step, which can be broken down into one or more smaller steps. Each of those steps might then be broken down further into even smaller steps. This division continues until the bottom is reached. To look at such an execution plan, you need to execute a hierarchical query such as the one shown here:
The START WITH and CONNECT BY clauses in this query are used to organize the results in a hierarchy. The ID and PARENT_ID fields in the plan table determine that hierarchy and each step is indented underneath its parent. The LPAD expression in the query's select list is used to indent the results to reflect the hierarchy. Each plan table record contains an ID and a PARENT_ID column. The results of each step are fed as input into the parent step, which is identified by the PARENT_ID. If this query is used to view the plan for the emp_report statement that was explained in the previous section, the following results will be displayed:
Query Plan
The step that is indented the most is executed first. In this example, the first step is a full table scan of the salgrade table. The results from this step are then fed as input into the parent step.
The next lesson will help you identify nested access paths.
SELECT LPAD(' ', 2*(level-1)) ||
  operation || ' ' || options
  || ' ' || object_name || ' ' ||
  DECODE(id, 0, 'Cost = ' || position)
  "Query Plan"
FROM plan_table
START WITH id = 0 AND statement_id = 'statement_id'
CONNECT BY PRIOR id = parent_id
  AND statement_id = 'statement_id';
The START WITH and CONNECT BY clauses in this query are used to organize the results in a hierarchy. The ID and PARENT_ID fields in the plan table determine that hierarchy and each step is indented underneath its parent. The LPAD expression in the query's select list is used to indent the results to reflect the hierarchy. Each plan table record contains an ID and a PARENT_ID column. The results of each step are fed as input into the parent step, which is identified by the PARENT_ID. If this query is used to view the plan for the emp_report statement that was explained in the previous section, the following results will be displayed:
Query Plan
-------------------------------------
SELECT STATEMENT Cost = 9
 SORT ORDER BY
  HASH JOIN
   MERGE JOIN CARTESIAN
    TABLE ACCESS FULL DEPT
     SORT JOIN
      TABLE ACCESS FULL SALGRADE
       TABLE ACCESS FULL EMP
The step that is indented the most is executed first. In this example, the first step is a full table scan of the salgrade table. The results from this step are then fed as input into the parent step.
The next lesson will help you identify nested access paths.