| Lesson 6 | Setting special trace events |
| Objective | Set events to produce trace files. |
Setting Special Trace Events
In tuning your database and troubleshooting, you may want to track certain
conditions so that you know precisely when they occur. Other times, when you know of problems or bugs, you may need the systems to ignore or
bypass them and continue functioning. In these cases, you can set events to produce trace files to do this.
There are four ways to set trace events, either Oracle-wide or for specific events. Let's look at the methods:
There are four ways to set trace events, either Oracle-wide or for specific events. Let's look at the methods:
- The init.ora file:You set generic events in the init.ora file to produce a trace file whenever a certain database condition occurs. These are done with the "set event" init.ora directive.
You can also use these set event statements to bypass bad blocks and to correct software problems. For example, the following events will correct errors when using Oracle bitmapped indexes:
#Following used for BITMAP indexes.
event = "10262 trace name context forever, level 1024"
event = "10269 trace name context forever, level 10"
event = "10061 trace name context forever, level 10"
This is a special parameter set at the request of Oracle technical support.
-
In your session
You can alter your own Oracle session to enable a trace file by entering the following command:
alter session set events
`<event_name><action>.
For example:
alter session set events
‘10046 TRACE NAME CONTEXT FOREVER, LEVEL 12’;
-
In another SQL session
You can use the dbms_system package to create trace files for other executing sessions. You call dbms_system.set_ev, and pass the SID, serial number, and event code to invoke the trace and the action level. Here is the syntax:set_ev(sid, ser#, event code, level, action).For example:
Execute dbms_system.set_ev(8, 219, 10046, 12, ‘ ‘);
-
Using Oracle debug tool
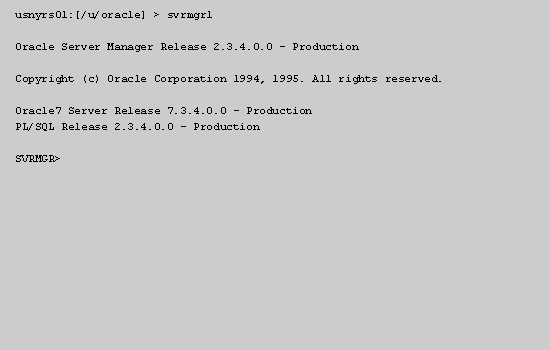
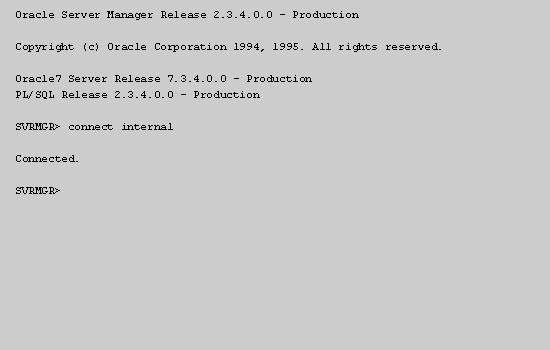
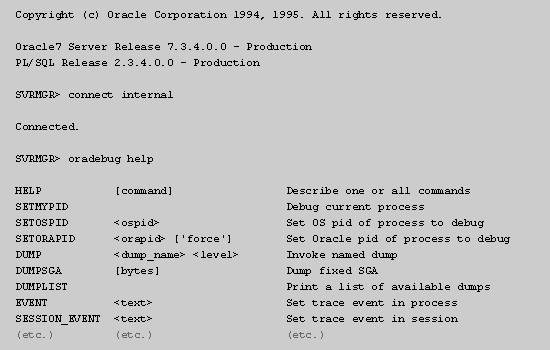
The Oracle debugger--oradebug--can also be used to enable tracing. The debugger must be executed from within Oracle's Server Manager (or from within Oracle Enterprise Manager if you're using Windows NT.)
The following simulation will illustrate how to use this feature.

1) Answer File 1
2) Answer File 2
3) Answer File 3
4) Answer File 4

5) Answer File 5
6) Answer File 6
7) Answer File 7
8) Answer File 8
9) Answer File 9
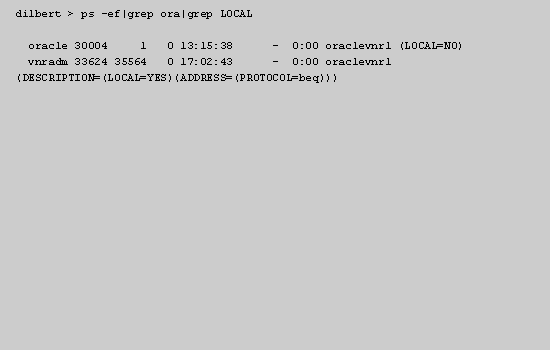
- First, you need to isolate all local Oracle processes to get their PIDs. At the UNIX prompt, enter (S7)ps -ef|grep ora|grep LOCAL (S0).
- Prompt
- ps -ef | grep ora | grep LOCAL
- (S0)Please type (S7)ps -ef|grep ora|grep LOCAL (S0) and hit Enter to continue.
- Now you've isolated the local Oracle processes with their corresponding PIDs. The one we are interested in here is PID 33624. Click anywhere in the simulation to return to the UNIX prompt.
- Anywhere
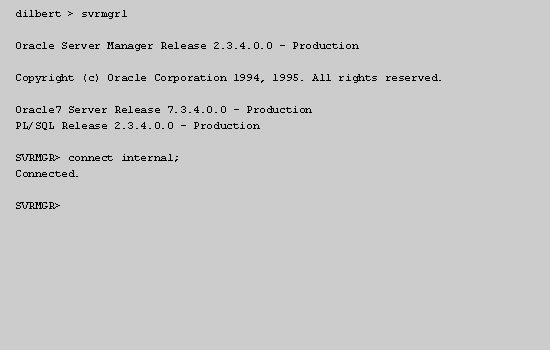
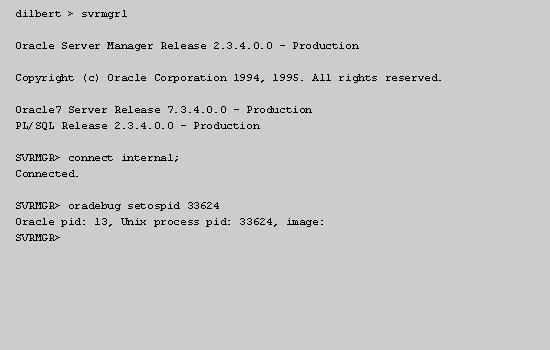
- You'll enter the server manager again. (We've done this step for you in the simulation) and this time, set the trace events for PID 33624. Type (S7)ora debug setospid 33624 (S0) and hit Enter.
- Prompt
- ora debug setospid 33624
- Please type (S7)ora debug setospid 33624 (S0) and hit Enter.
Using oradebug (Simulation transcript)
- First, you need to isolate all local Oracle processes to get their PIDs. At the UNIX prompt, enter
ps -ef|grep ora|grep LOCAL.
- Now you've isolated the local Oracle processes with their corresponding PIDs. The one we're interested in here is PID 33624. Click anywhere in the simulation to return to the UNIX prompt.
- You will enter the server manager again. (We've done this step for you in the simulation) and this time, set the trace events for PID 33624.
Type
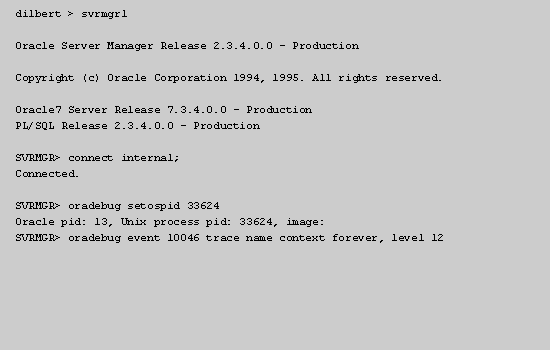
ora debug setospid 33624and hit Enter. - Finally, set Oracle debugging for event 10046. This event enables SQL statement timing so you can see the time required for each SQL statement in the task to execute. Enter oradebug event 10046 trace name context forever, level 12.
The next lesson concludes this module.
Setting Trace Events - Exercise
Now that you're familiar with Oracle trace files, click the Exercise button to complete a brief exercise.
Setting Trace Events - Exercise
Setting Trace Events - Exercise